How to Place a Trade with Deriv Go Trader
Master the trading interface: Selecting assets, configuring strategies, and executing your first automated trade.
How to Place a Trade
Now that your bot is installed and connected, let's get to the exciting part: trading. Deriv Go Trader is designed to be intuitive, giving you powerful controls without the clutter.
The Dashboard Overview
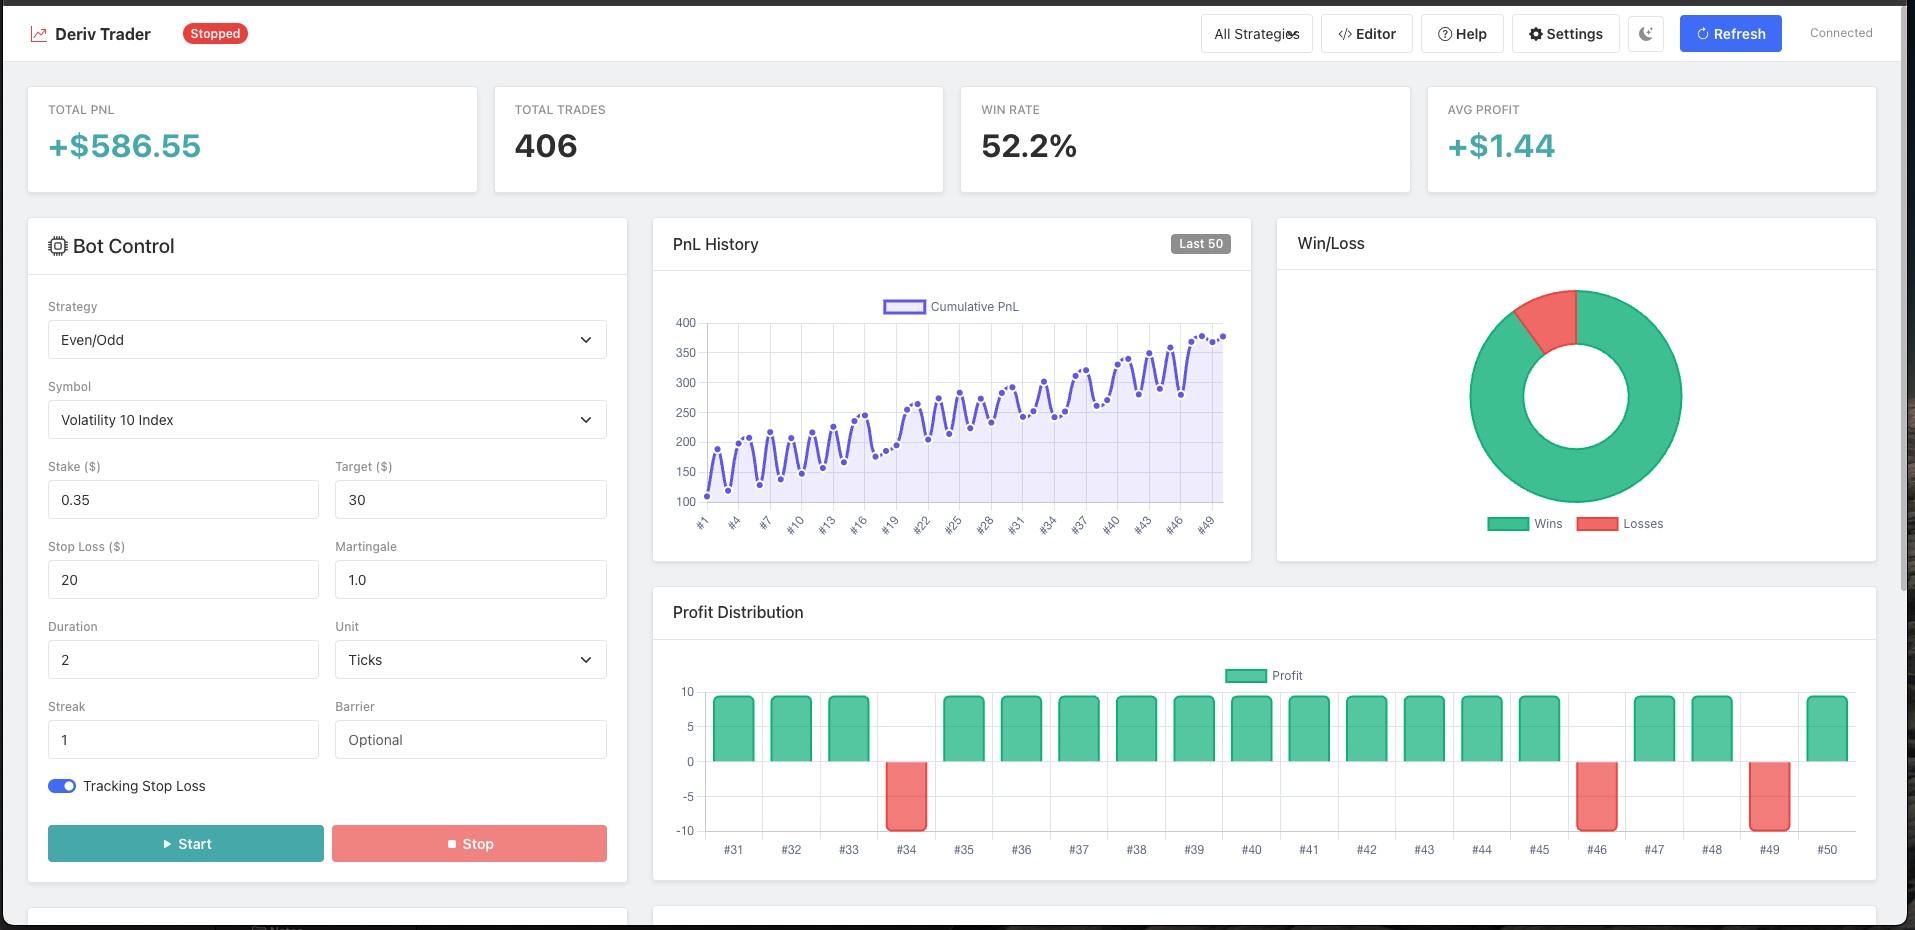
When you open the app, you'll see the main trading dashboard.
- Left Panel: Asset selection and market watch.
- Center: Real-time chart and indicators.
- Right Panel: Trade parameters (Stake, Strategy, Limits).
Steps to Execute a Trade
1. Select an Asset
On the top-left dropdown, select the market you want to trade on.
- Popular: Volatility 100 (1s) Index, Volatility 75 Index.
- Forex: EUR/USD, GBP/USD (if supported by your strategy).
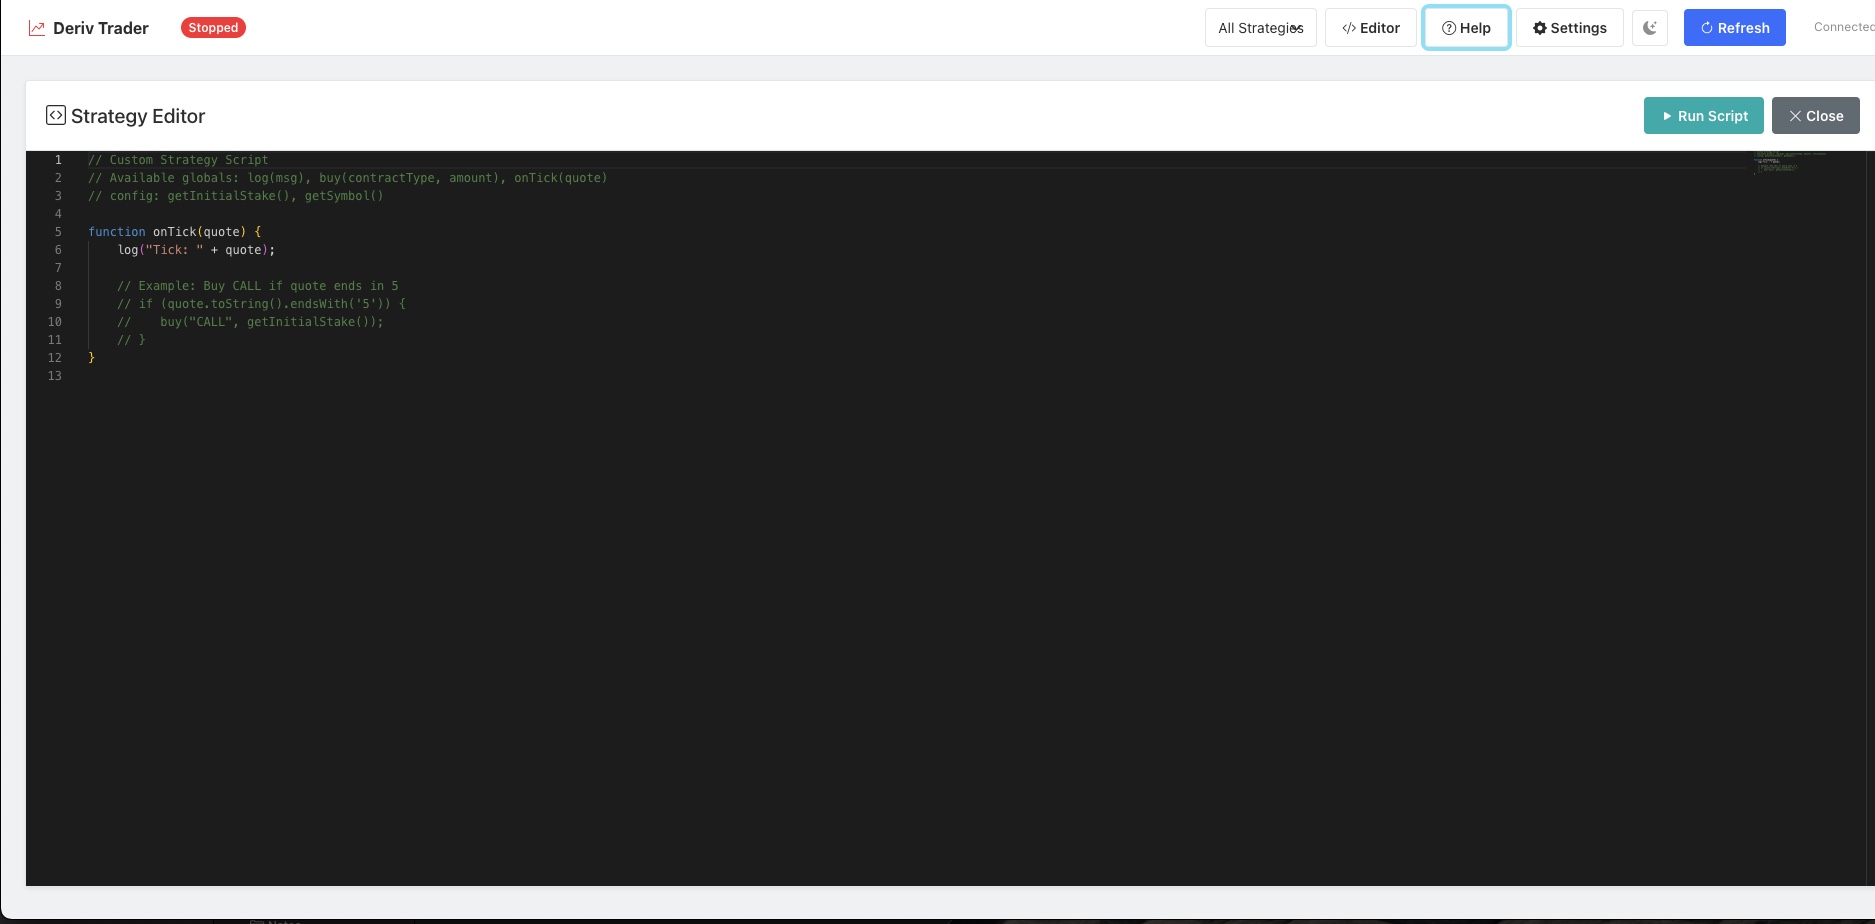
2. Choose Your Strategy
In the right panel, look for the "Strategy" selector. Deriv Go Trader comes with built-in strategies like:
- Rise/Fall: Simple directional betting.
- Even/Odd: Digit matching strategies.
- Higher/Lower: Barrier-based trades.
Select the one that matches your current market analysis.
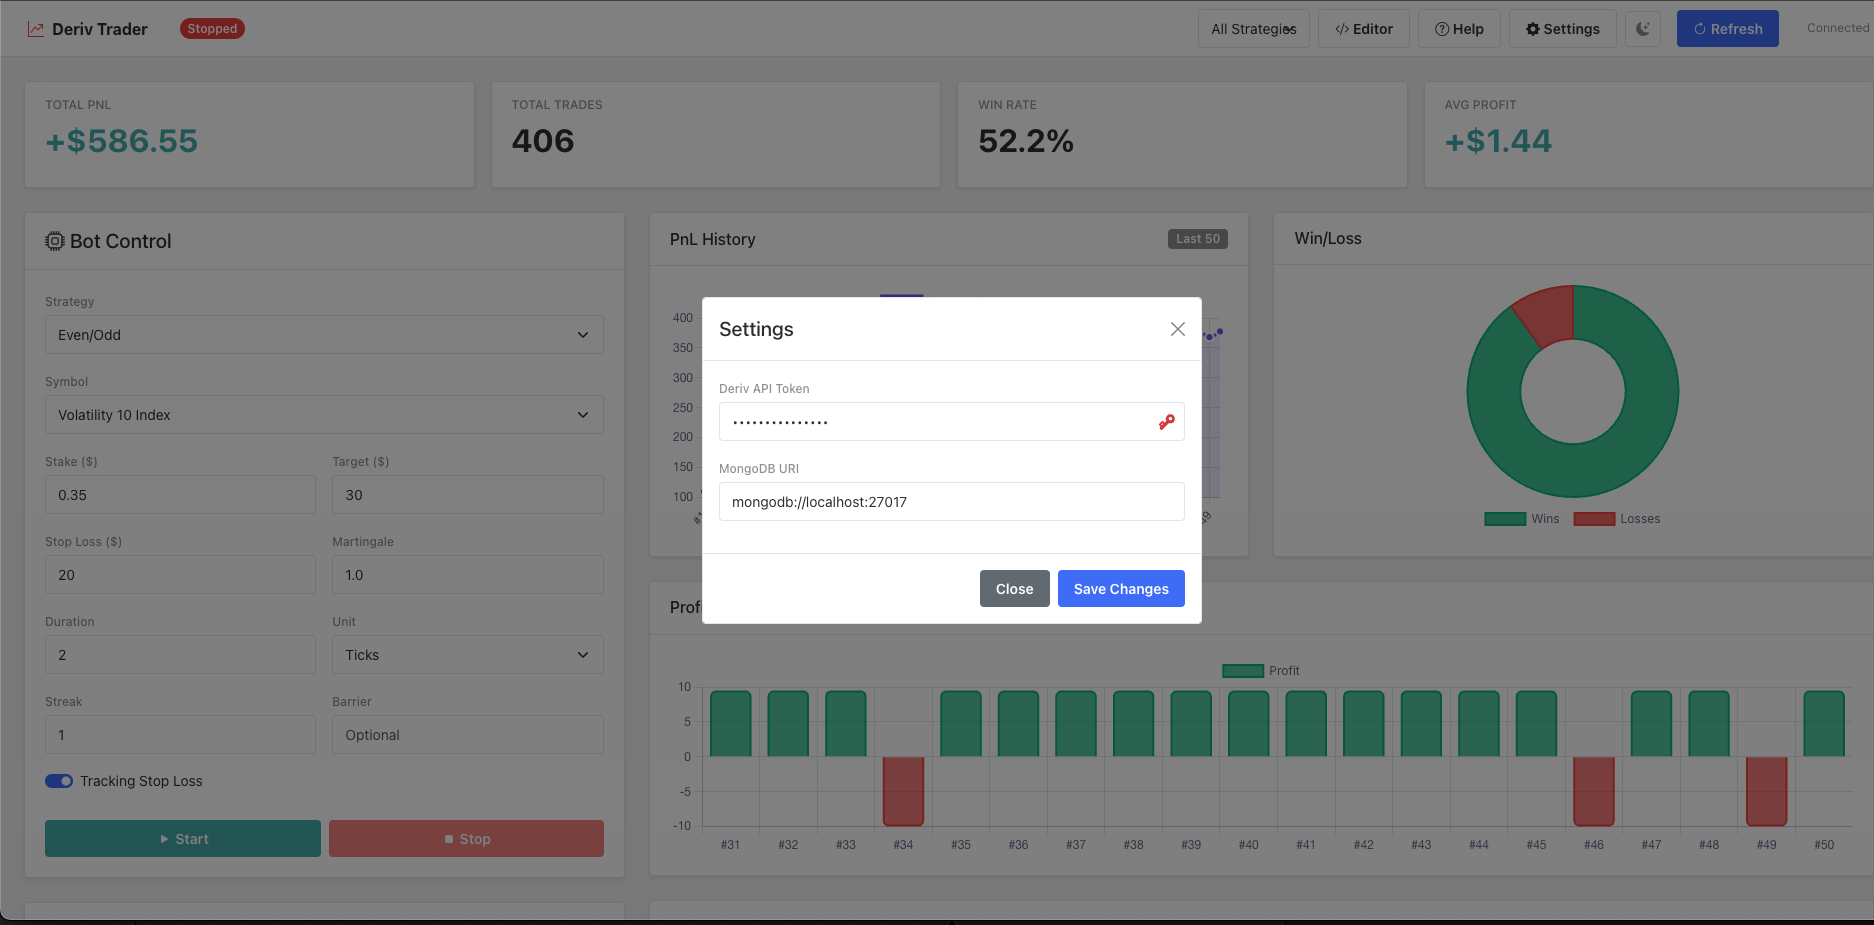
3. Configure Trade Parameters
Set your risk management rules before starting the bot:
- Stake: The amount to wager per trade (e.g., $1.00).
- Take Profit (TP): The bot will stop if total profit reaches this amount.
- Stop Loss (SL): The bot will emergency stop if total loss reaches this amount.
- Martingale Factor: (Optional) Multiplier for the next stake after a loss.
Tip: Always set a Stop Loss! It protects your account from unexpected market streaks.
4. Start the Bot
Once configured, click the large "Run Bot" button (usually Green).
- The status will change to "Running".
- You will see logs appearing in the "Trade History" or "Console" panel at the bottom, showing the bot analyzing ticks and placing orders.
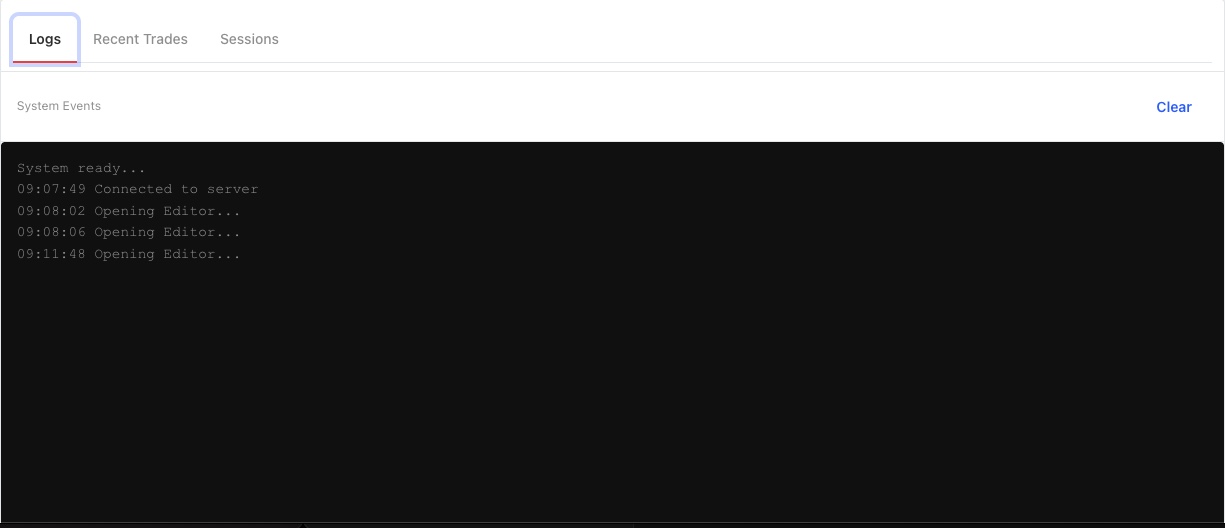
5. Monitoring and Stopping
Watch the performance graph update in real-time.
- Green dots indicate wins.
- Red dots indicate losses.
To stop the bot manually, click the "Stop" button (Red). The bot will finish the current active trade (if any) and then halt operations.
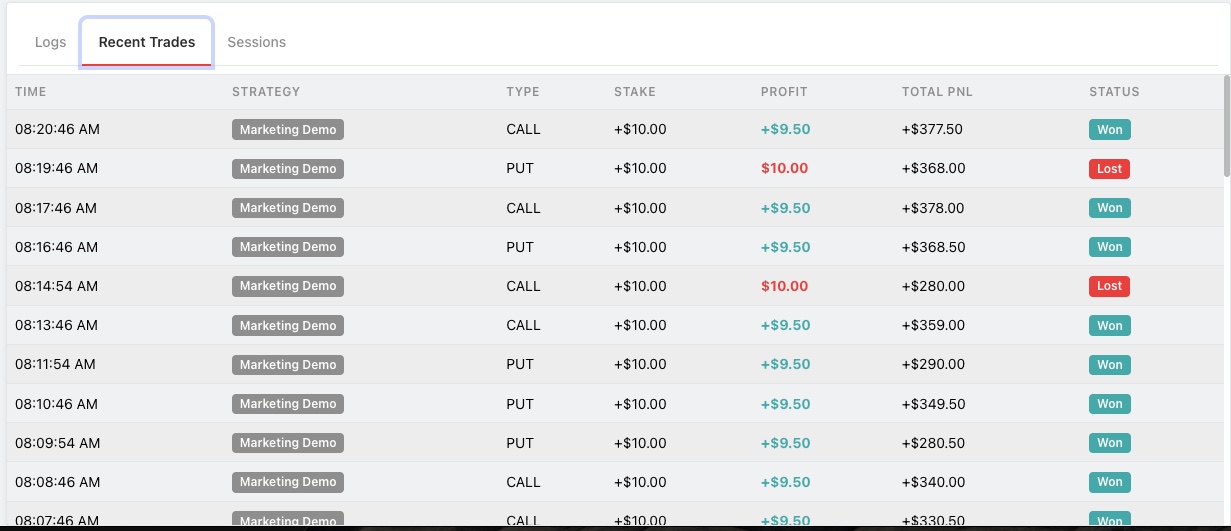
Analyzing Results
After your session, go to the "History" tab to see a detailed breakdown of all trades, including timestamps, entry/exit prices, and profit.
Happy Trading!